1: A quick use case for MICADO at the ELT
A brief introduction into using ScopeSim to observe a cluster in the LMC
[1]:
from tempfile import TemporaryDirectory

import matplotlib.pyplot as plt
from matplotlib.colors import LogNorm
%matplotlib inline

import scopesim as sim
import scopesim_templates as sim_tp

# [Required for Readthedocs] Comment out this line if running locally
tmpdir = TemporaryDirectory()
sim.rc.__config__["!SIM.file.local_packages_path"] = tmpdir.name
Download the required instrument packages for an observation with MICADO at the ELT
[2]:
sim.download_packages(["Armazones", "ELT", "MAORY", "MICADO"])
[2]:
['C:\\Users\\Kieran\\AppData\\Local\\Temp\\tmpxhqx8_if\\Armazones.zip',
 'C:\\Users\\Kieran\\AppData\\Local\\Temp\\tmpxhqx8_if\\ELT.zip',
 'C:\\Users\\Kieran\\AppData\\Local\\Temp\\tmpxhqx8_if\\MAORY.zip',
 'C:\\Users\\Kieran\\AppData\\Local\\Temp\\tmpxhqx8_if\\MICADO.zip']
Create a star cluster using the scopesim_templates package
[3]:
cluster = sim_tp.stellar.clusters.cluster(mass=1000,         # Msun
                                          distance=50000,    # parsec
                                          core_radius=0.3,     # parsec
                                          seed=9002)
INFO - sample_imf: Setting maximum allowed mass to 1000
INFO - sample_imf: Loop 0 added 1.26e+03 Msun to previous total of 0.00e+00 Msun
Make the MICADO optical system model with OpticalTrain. Observe the cluster Source object with the .observe() method and read out the MICADO detectors with .readout().
The resulting FITS file can either be returned as an astropy.fits.HDUList object, or saved to disk using the optional filename parameter
[4]:
micado = sim.OpticalTrain("MICADO")
micado.observe(cluster)
hdus = micado.readout()
# micado.readout(filename="TEST.fits")
Warning: header update failed, data will be saved with incomplete header.
Reason:  <class 'ValueError'> !OBS.instrument was not found in rc.__currsys__
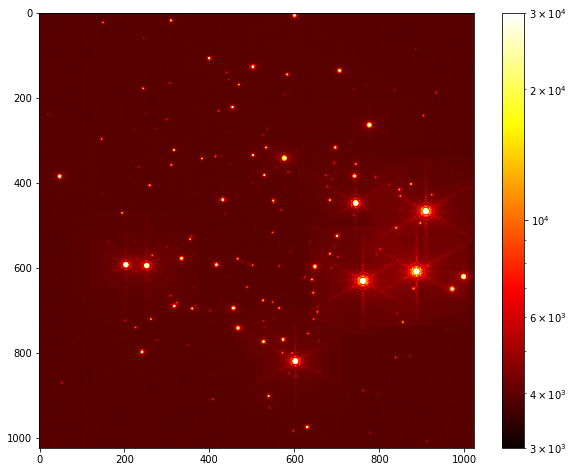
Display the contents the first HDU
[5]:
plt.figure(figsize=(10,8))
plt.imshow(hdus[0][1].data, norm=LogNorm(), vmax=3E4, vmin=3E3, cmap="hot")
plt.colorbar()
[5]:
<matplotlib.colorbar.Colorbar at 0x29c99d34588>
TL;DR
import scopesim as sim
import scopesim_templates as sim_tp

sim.download_packages(["Armazones", "ELT", "MAORY", "MICADO"])

cluster = sim_tp.stellar.clusters.cluster(mass=1000,         # Msun
                                          distance=50000,    # parsec
                                          core_radius=0.3,     # parsec
                                          seed=9002)

micado = sim.OpticalTrain("MICADO")
micado.observe(cluster)

hdus = micado.readout()
# micado.readout(filename="TEST.fits")