2: Observing the same object with multiple telescopes
A brief introduction into using ScopeSim to observe a cluster in the LMC using the 39m ELT and the 1.5m LFOA
[1]:
from tempfile import TemporaryDirectory

import matplotlib.pyplot as plt
from matplotlib.colors import LogNorm
%matplotlib inline

import scopesim as sim
import scopesim_templates as sim_tp

# [Required for Readthedocs] Comment out these lines if running locally
tmpdir = TemporaryDirectory()
sim.rc.__config__["!SIM.file.local_packages_path"] = tmpdir.name
Download the packages for MICADO at the ELT and the viennese 1.5m telescope at the LFOA
[2]:
sim.download_packages(["LFOA"])
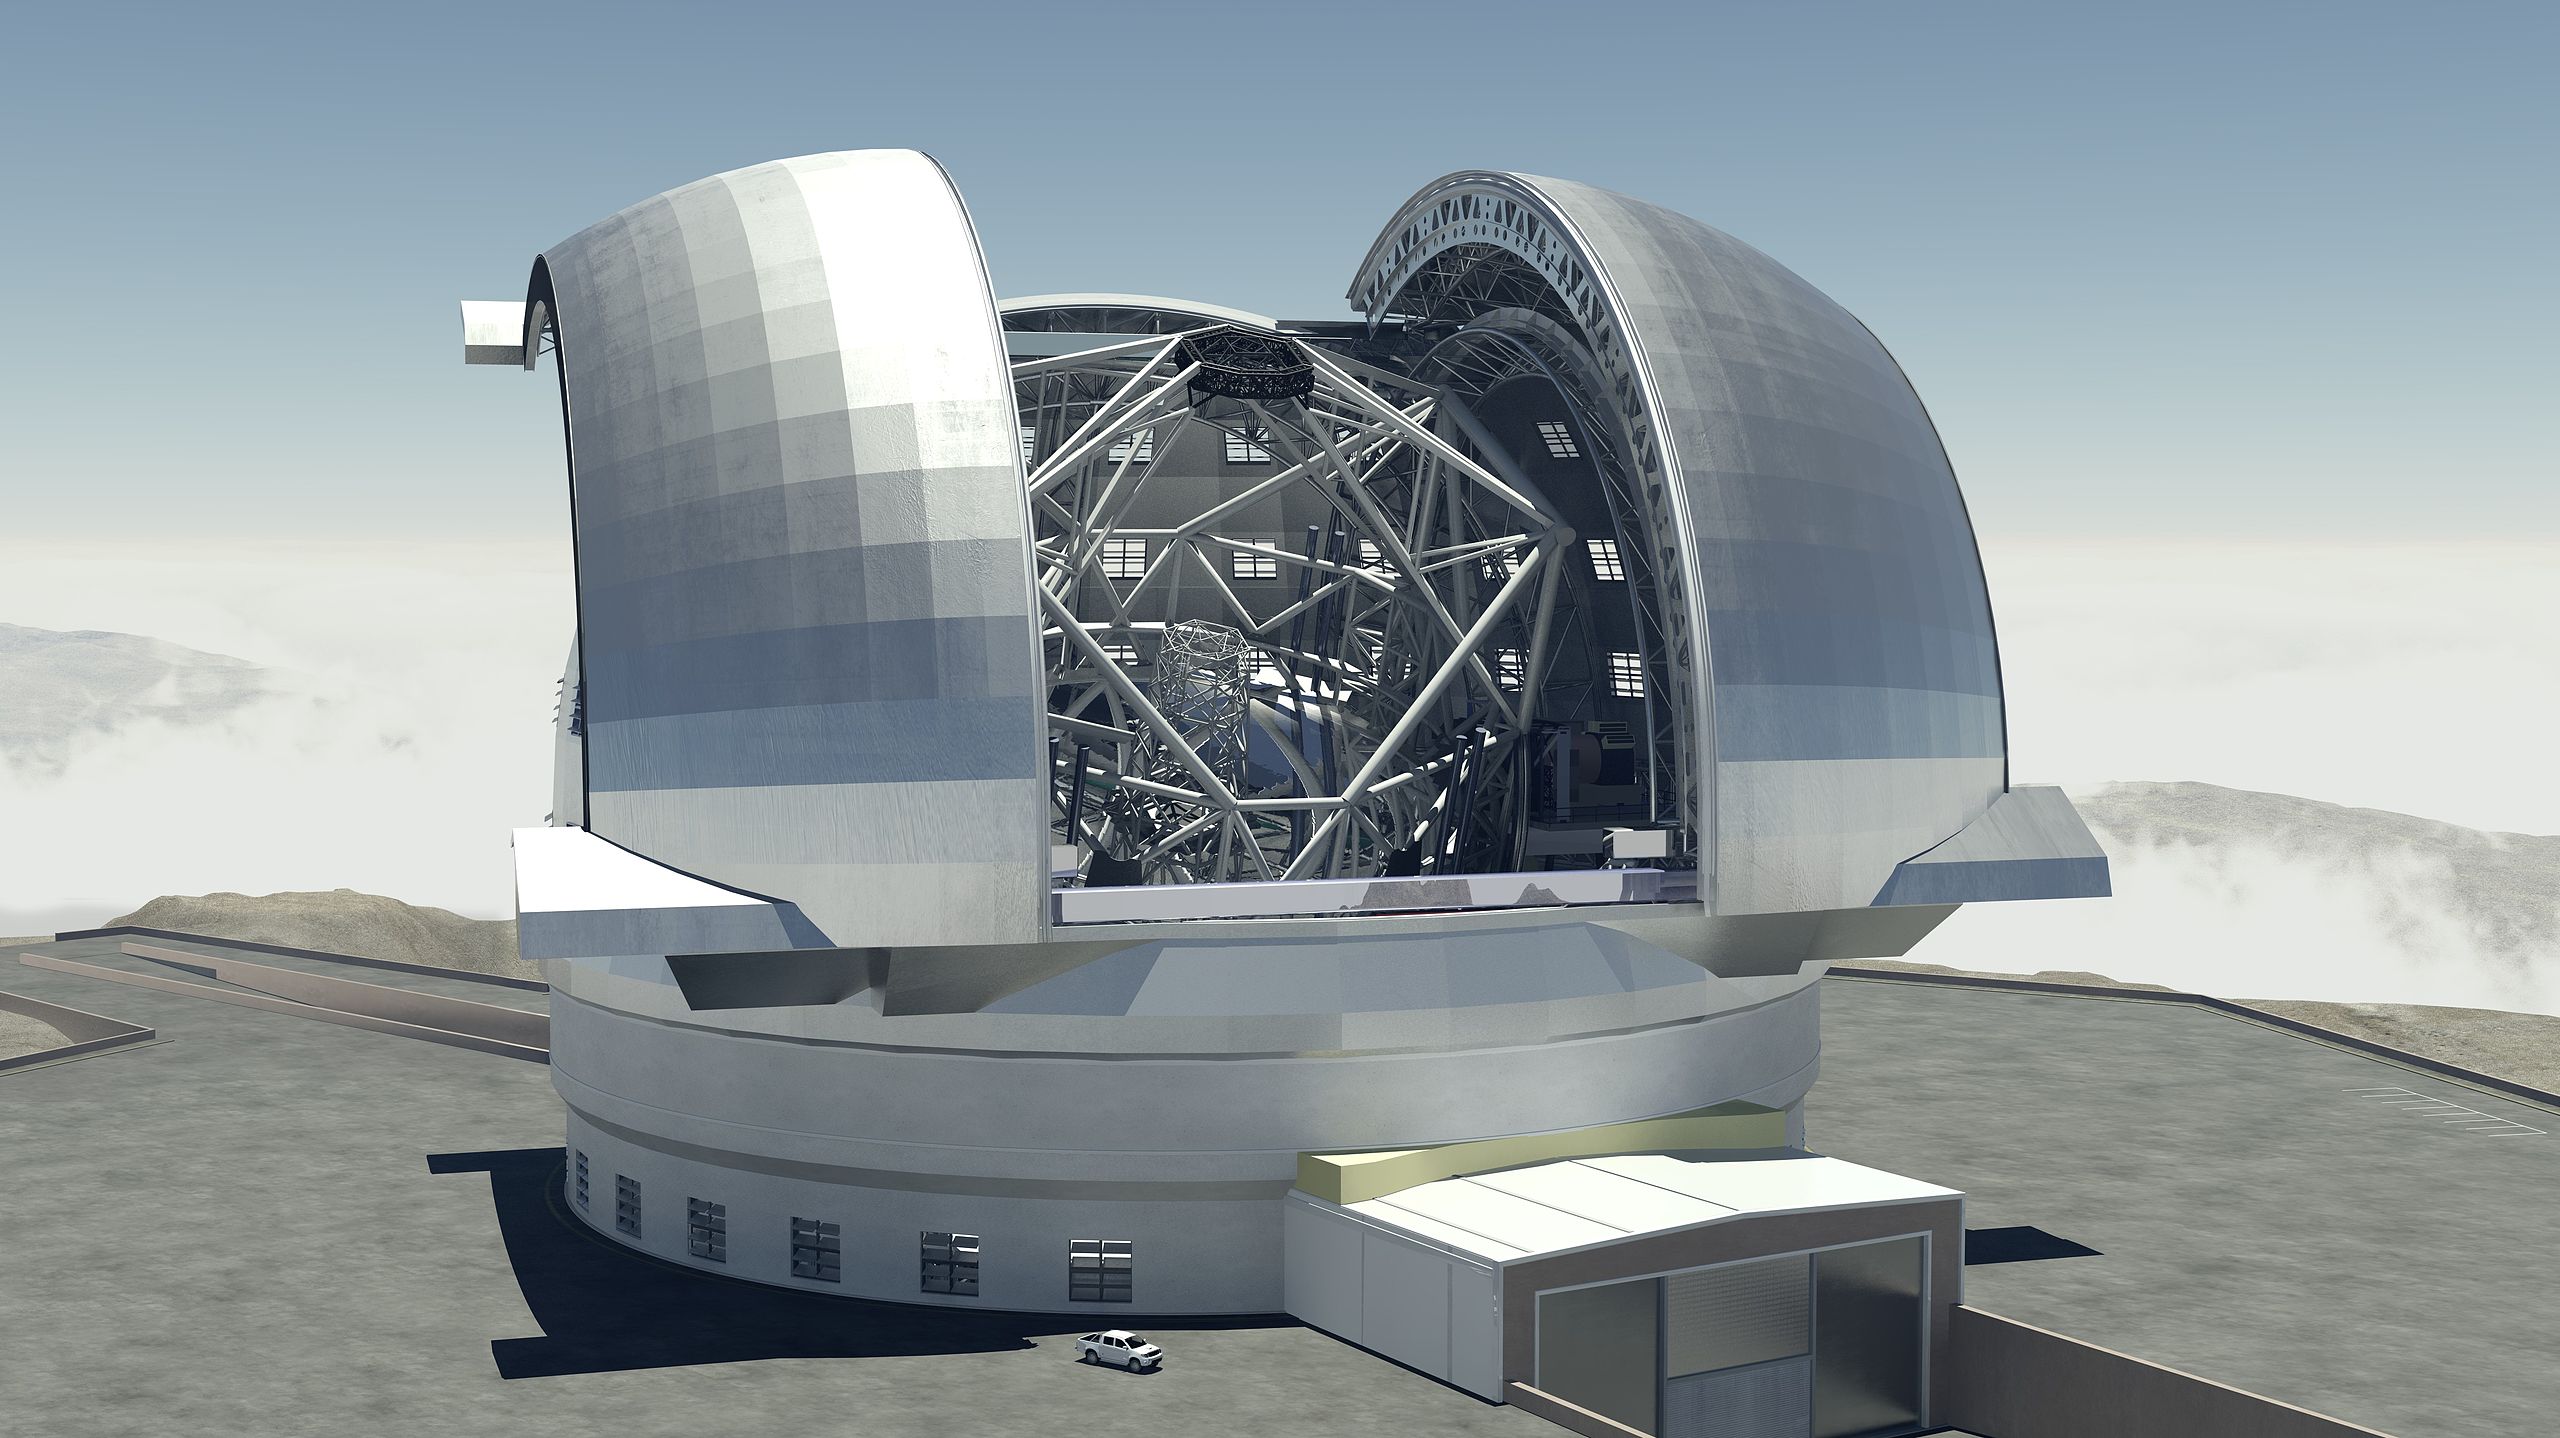
sim.download_packages(["Armazones", "ELT", "MICADO", "MAORY"])
[2]:
['C:\\Users\\Kieran\\AppData\\Local\\Temp\\tmp3bqenznv\\Armazones.zip',
 'C:\\Users\\Kieran\\AppData\\Local\\Temp\\tmp3bqenznv\\ELT.zip',
 'C:\\Users\\Kieran\\AppData\\Local\\Temp\\tmp3bqenznv\\MICADO.zip',
 'C:\\Users\\Kieran\\AppData\\Local\\Temp\\tmp3bqenznv\\MAORY.zip']
Create a star cluster Source object
[3]:
cluster = sim_tp.stellar.clusters.cluster(mass=10000,        # Msun
                                          distance=50000,    # parsec
                                          core_radius=2,     # parsec
                                          seed=9001)         # random seed
INFO - sample_imf: Setting maximum allowed mass to 10000
INFO - sample_imf: Loop 0 added 1.01e+04 Msun to previous total of 0.00e+00 Msun
Observe with the 1.5m telescope at the LFOA
|ff4a28707f874176b8ad9f0fea1e6922|
[4]:
lfoa = sim.OpticalTrain("LFOA")
lfoa.observe(cluster,
             properties={"!OBS.ndit": 10, "!OBS.ndit": 360},
             update=True)
hdus_lfoa = lfoa.readout()
Warning: header update failed, data will be saved with incomplete header.
Reason:  <class 'ValueError'> !OBS.instrument was not found in rc.__currsys__
Observe the same Source with MICADO at the ELT
[5]:
micado = sim.OpticalTrain("MICADO")
micado.cmds["!OBS.dit"] = 10
micado.cmds["!OBS.ndit"] = 360
micado.update()

micado.observe(cluster)
hdus_micado = micado.readout()
Warning: header update failed, data will be saved with incomplete header.
Reason:  <class 'ValueError'> !OBS.instrument was not found in rc.__currsys__
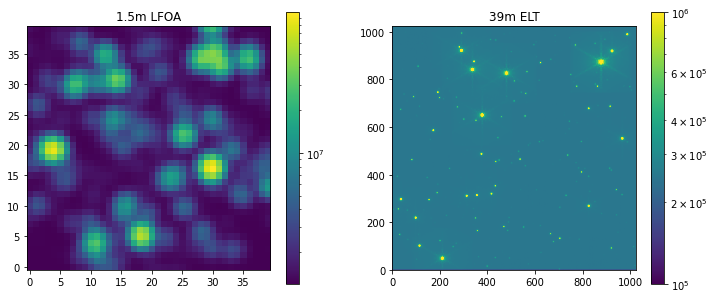
Plot up the results
[6]:
plt.figure(figsize=(12,5))

plt.subplot(121)
plt.imshow(hdus_lfoa[0][1].data[345:385, 525:565], norm=LogNorm(), origin="lower")
plt.colorbar()
plt.title("1.5m LFOA")

plt.subplot(122)
plt.imshow(hdus_micado[0][1].data, norm=LogNorm(), origin="lower", vmax=1E6, vmin=1e5)
plt.colorbar()
plt.title("39m ELT")
[6]:
Text(0.5, 1.0, '39m ELT')
[ ]: